Customer Segmentation
Analyst & Visualization
About The Project
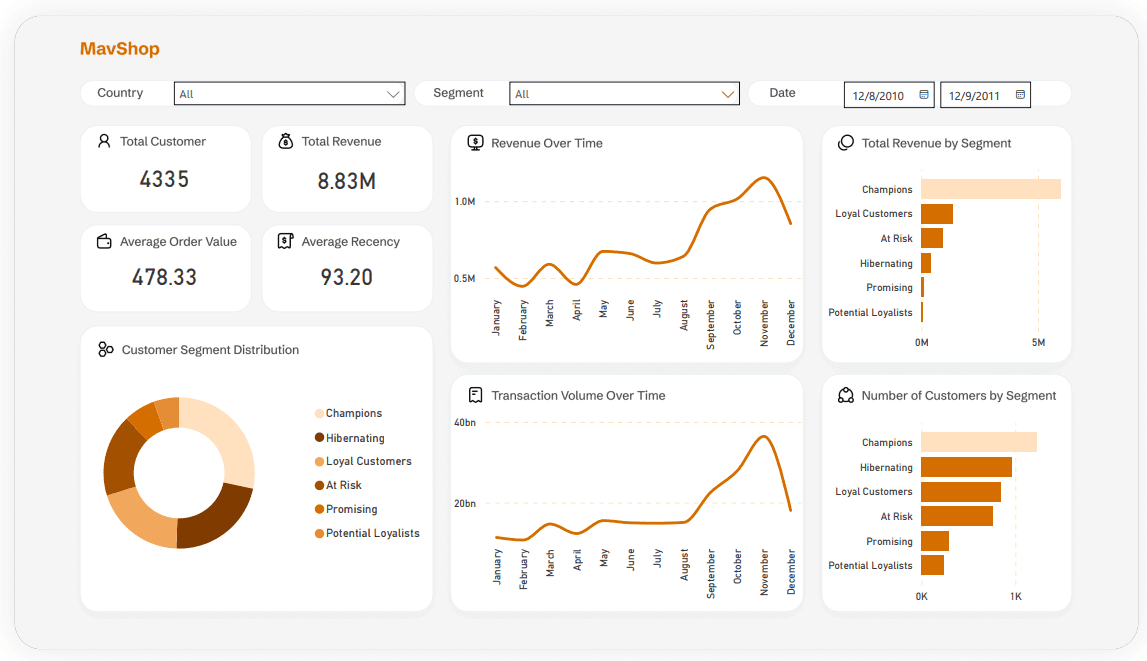
This project aims to perform customer segmentation using the RFM (Recency, Frequency, Monetary) method. The object of this analysis is an online retail store called **Mavshop**. The analysis process combines several tools to ensure an efficient workflow and produce engaging visualizations.
Tools & Libraries : Python, Google Colab, Pandas, Power BI Desktop, Figma
Achievements
Segmented 4,335 customers contributing $8.83M in revenue using RFM analysis, uncovering key behavioral patterns for targeted marketing.
Identified high-value segments, with "Champions" as top revenue drivers and "Hibernating" as high-potential re-engagement targets.
Built an interactive Power BI dashboard, enabling stakeholders to track KPIs (e.g., AOV $478.33) and make data-informed strategic decisions.
Links

azzriala@gmail.com
+6287872788220